Creating a performance test with Ruby or Taurus for BlazeMeter
Ok, so I’ve been so involved lately in designing performance tests reports for detecting potential performance or bottleneck issues in web applications that I’ve spent a lot of time evaluating different tools, some are great other have a lot potential as they are making innovative approaches for test execution and reporting.
But I ended up using for the specific project need a couple of tools around JMeter, which is a very well-known tool for aiding in the creation of performance test scenarios. Using a Java UI however is a bit tedious, at least for me so I investigated a bit if there was anything that could help us script the whole thing (yeah, I’m lazy).
The first one was a really cool ruby gem that’s called ruby-jmeter which is a little DSL around all the JMeter controllers, and let us generate JMX files. These JMX files are XML code that instructs JMeter how to behave for an specific scenario.
Here’s an example of such test,
require 'ruby-jmeter'

def browser_options
  with_user_agent :chrome_osx
  cookies policy: 'rfc2109', clear_each_iteration: true
end

def add_listeners
  view_results_tree
  summary_report
  generate_summary_results
end

def name_base
  __FILE__.split('.').first
end

test do

  threads on_sample_error: 'continue',
          count: 2,
          continue_forever: true,
          scheduler: true,
          duration: 60 do

    browser_options
    visit name: 'CV Izaac', url: 'https://www.izaac.me',
        connect_timeout: 2000,
        response_timeout: 20000 do
          assert 'contains': 'ISQI005548'
        end
  end
  add_listeners
end.jmx
I’m using the 2.13.x gem, the 3.x has many DSL changes so this may not work with 3.x I haven’t tested it yet. Ok so this generates a jmx file, this file can be loaded then in JMeter and executed locally or can also feed another super cool tool I’ve found that’s called, Taurus.
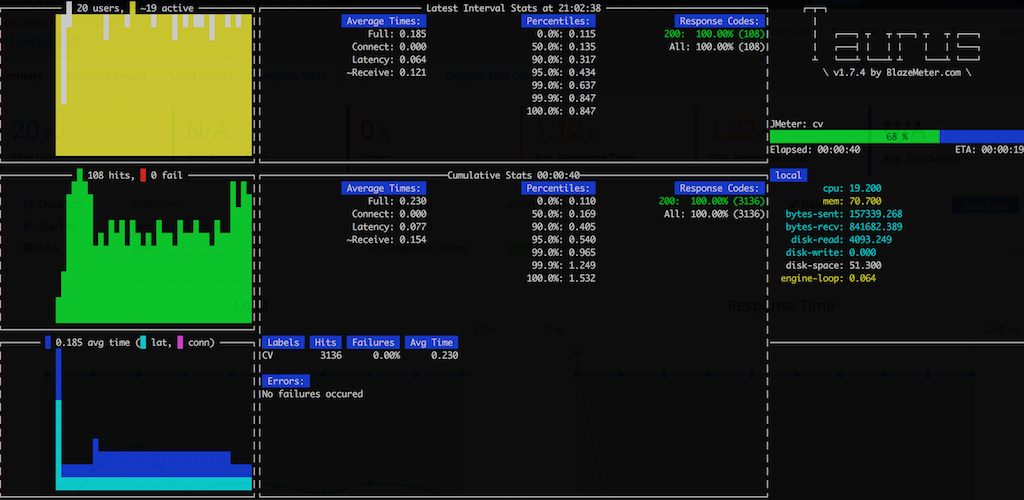
Taurus is a Python library and can be easily installed using pip, once it is installed and available in our PATH, the bzt command tool can be used to execute the JMX, if JMeter is not installed it will download it for us and it will expect a correct JAVA_HOME in the system.
Something cool about Taurus is that it has its own little language for defining tests instead of using JMX files, JMeter has a steep learning curve and might not be as easy for tests not that complex.
The following is the same JMX test I wrote above but this time I’m using Tauros test YAML file definition.
---
execution:
  - concurrency: 20
    rampup: 10s
    hold-for: 1m
    scenario: cv

modules:
  blazemeter:
    token: <place a valid blazemeter API key or remove module for anonymous use>

scenarios:
  cv:
    headers:
      Accept-Encoding: gzip, deflate
      User-Agent: Mozilla/5.0 (Macintosh; Intel Mac OS X 10_7_4) AppleWebKit/536.5
        (KHTML, like Gecko) Chrome/19.0.1084.46 Safari/536.5
    store-cache: false
    store-cookie: true
    use-dns-cache-mgr: false
    requests:
      - assert:
        - contains:
          - ISQI005548
          not: false
          regexp: true
          subject: body
        url: https://www.izaac.me:443/
        method: GET
        label: CV
        timeout: 2000ms

services:
- module: passfail
  criteria:
  - "avg-rt>7000ms for 10s, continue as failed"
  - "fail>50% for 10s, stop as failed"

reporting:
- module: final_stats
  summary: true  # overall samples count and percent of failures
  percentiles: true  # display average times and percentiles
  failed-labels: false  # provides list of sample labels with failures
  test-duration: true  # provides test duration
  dump-csv: exec.csv
  dump-xml: exec.xml
- module: console
- module: junit-xml
  filename: junit.xml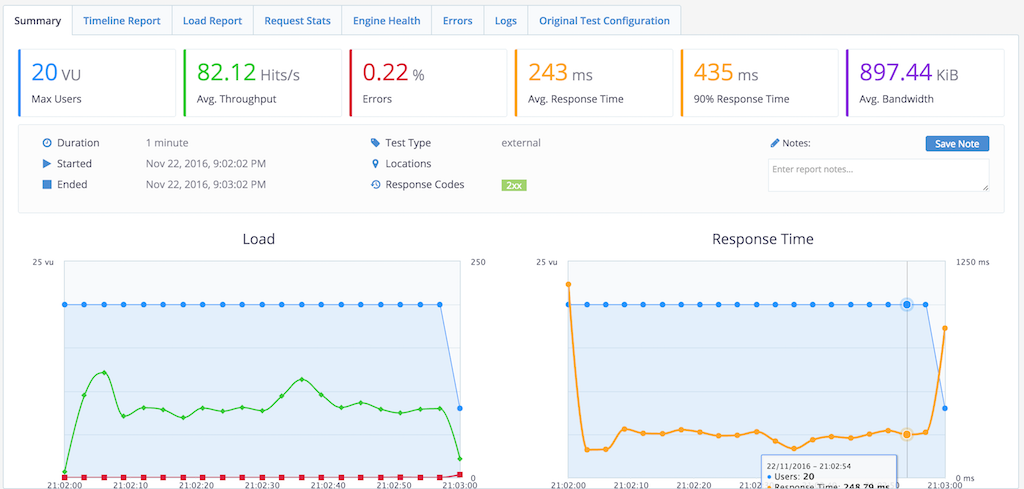
As you can see it’s super easy and it’s just matter of using the bzt executable Taurus provides to execute the test.
I hope you find it useful and help you get you started with performance test tools.